KAGGLE COMPETITION - PREDICTING HOUSING PRICES USING ADVANCED REGRESSION TECHNIQUES
- Amar Haiqal Che Hussin
- Nov 28, 2021
- 2 min read

Overview
This is my second time participating in Kaggle Competition, which the case study is about predicting the price of the house based on the features given. This is what they called a "Getting Started" competition which is suitable for those who wants to test the water in machine learning world. Eventhhough for me, it is rather quite tough especially in the data-preprocessing part
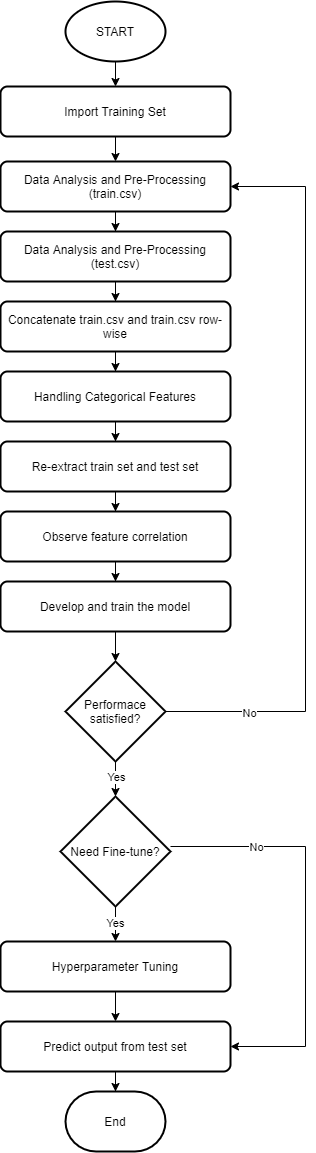
The flowchart on how I executed the task is as shown below:
Excecution
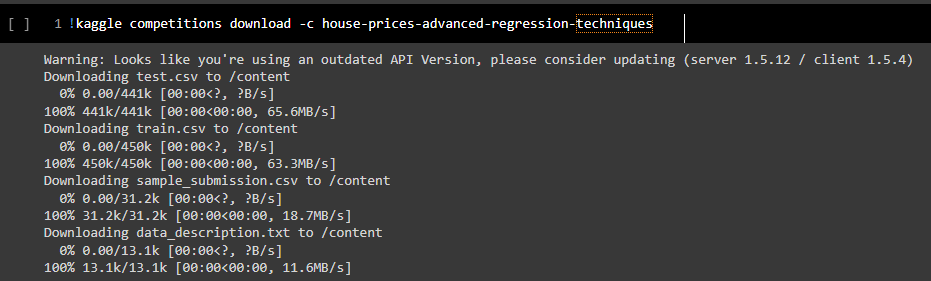
I developed the machine learning models and perform all those pre-processing in Google Colab. So, what I need to do first is to import Kaggle token and importing the dataset from the Kaggle into my workspace
Once the dataset has been imported, I proceed to pre-process the data, starting with the training data first. I can just use simple command as
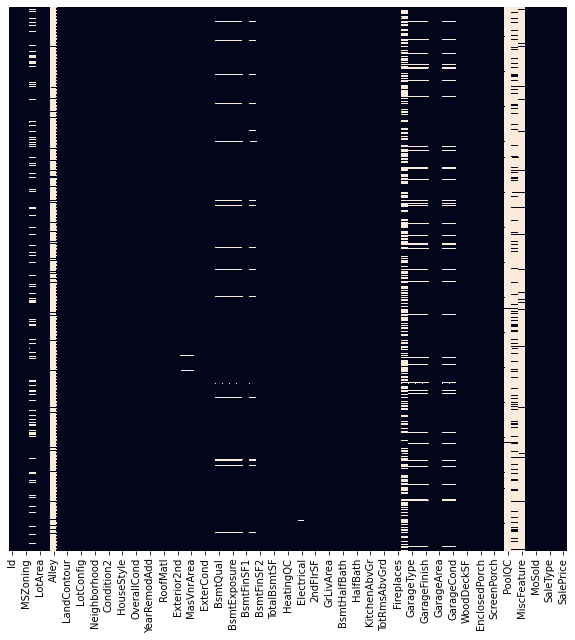
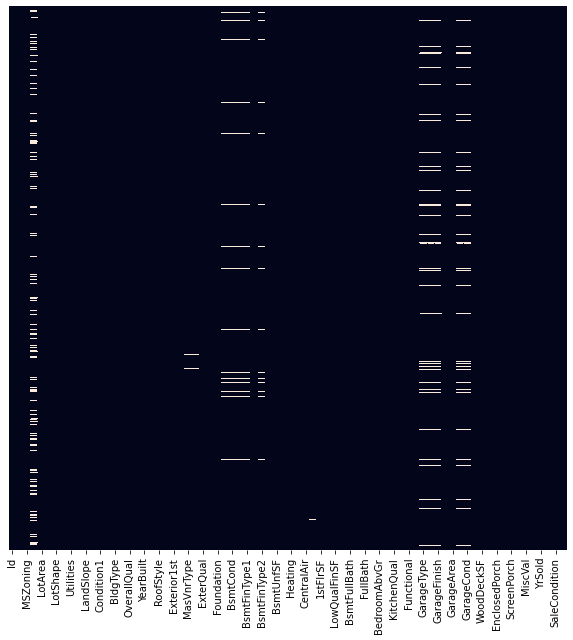
df.info()To see how many non-null values in every input. But since there are too many columns to deal with, it is much easier to illustrate as heatmap as shown below. Those white splothces indicates missing data. Some of it just several cell but you may noticed there are several columns that have too many missing data. These columns needs to be removed
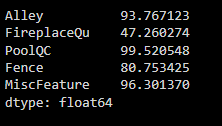
My intuition says that any features with more than 40% missing data is unacceptable, thus, I find which columns that belongs to this category
Second time visualising data in heatmap,
A bit better, but still not enough
Next, I replace all NaN is numerical columns with mean while categorical columns with the mode. However for some reason it still does not work. So I handled those problematic feautes one by one, until the data is fully clean as shown below:

Now that's more like it. Now we can do the same with the test data. Next step is we want to encode those categorical features. The thing is, there is a possibility that there will be some categorical values that present in the Test set but not in training set or vice versa.
For instance
Type_in_Training_set = ["a" , "b", "d"]Type_in_Test_set = ["a", "b", "c", "d"]Once we concatenated the data, we can encode the categorical features by introducing dummy variables
Now, we can split back the dataset to its original constituent. By right, the dataset for me its good to go. But what I wanted to do is to observe the correlation between features and the SalePrice and categorized it under highest and lowest correlation

I wanted to do Collinearity analysis but that will be on another submission. So let's proceed with model development. The model is traine with 10-fold cross validation using RMSE as metric. The scoring for each fold is as show below

I think there is something I need to alter on, but this time, let's continue to predict using the test set right away

After submission. I was ranked 2542 with Test set RMSE of 0.14766

I think this is a good start and I can't wait to see how it performs once the hyperparameter tuning is performed

Comments