CLASSIFICATION OF DISTILLATION COLUMN FAULT USING XGBOOST
- Amar Haiqal Che Hussin
- Nov 4, 2021
- 2 min read

From the distillation column data generated before, we will use it to generate an XGBoost model to predict if there is any fault in the column
First thing first, we need to import and inspect the data
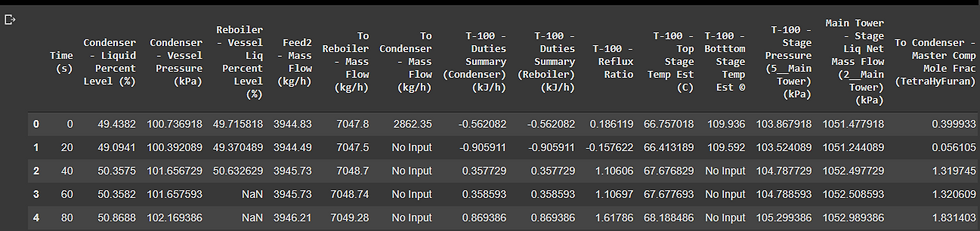
As you might noticed, the data is not really that clean. Those NaNs, unrelated strings and whatnot, these need to be removed and replaced with values. You can either do so using pandas libraries or Excel before importing the data in the first place. Despite pre-processing the data in python is usually the one of the common step in machine learning, I would recommend the latter. It's much more easier
In Excel, navigate to Find & Select > Go To Special > select Text and Errors constant

And lo and behold, it selects all the cells contain text, you can repeat the steps for the blanks.

Now you need to replace it with values, usually they will substitute those cells with median, mean or the previous values. For this time, I will replace it with the previous value. To do so, repeat the previous step to select all blanks, then press the Up arrow key to select the cell above it, then press Ctrl + Enter, the values will be replaced by the previous cell values
Next, we do the usual thing, extracting features, splitting into training and testing, and train the model. But before that, what I like to do is to inspect the train and test data to ensure all classes of output are present

Alright, nice, all faults are present in both sets, now we train the model and apply 10-fold cross validation, then we test the model
As expected, XGBoost exhibit an excellent performance in predicting the status of the distillation column


Comments