DISTILLATION COLUMN FAULT DETECTION USING PCA
- Amar Haiqal Che Hussin
- Nov 8, 2021
- 3 min read

Updated: Nov 22, 2021
Overview
Principal Component Analysis is a part of singular value decomposition (SVD). The SVD plays an important role in data compression and finding hidden features. PCA works by taking input and return into a new reconstructed dataset. PCA in this context are used to identify hidden patterns from high dimension data (or to out simple, data with numerous features). Other uses of PCA is for dimensionality reduction
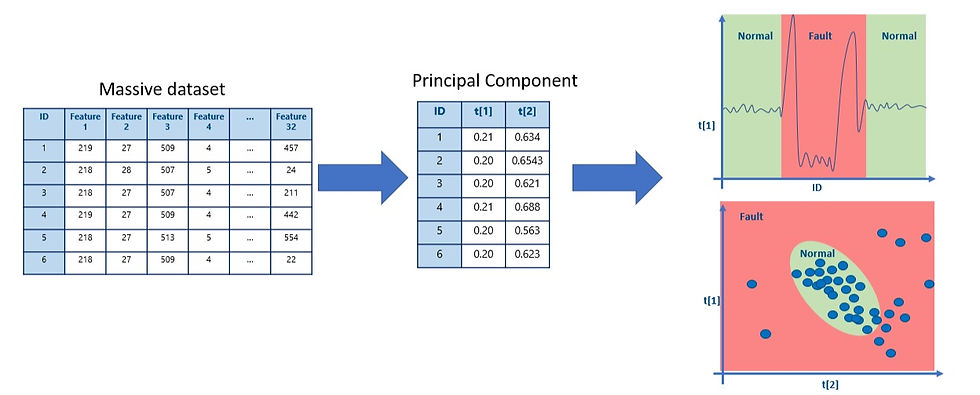
The oversimpified illustration on how I'm going to perform PCA is as shown below:

There are multiple journal articles suggested that PCA can be used in fault detection as it unravels hidden patterns from the dataset. Our intuition suggested that the process fault is indicated by abnormalities observed in the PCA values or visualization.
Execution (For Demonstration Purpose)
I'm going to use the dataset of a distillation column generated in Aspen HYSYS which I had simulated multiple process fault based on one of the research papers. I have made labels on the dataset where normal operation is indicated by OK while any process fault will be classified by Fx where x is the code numbers as shown below:
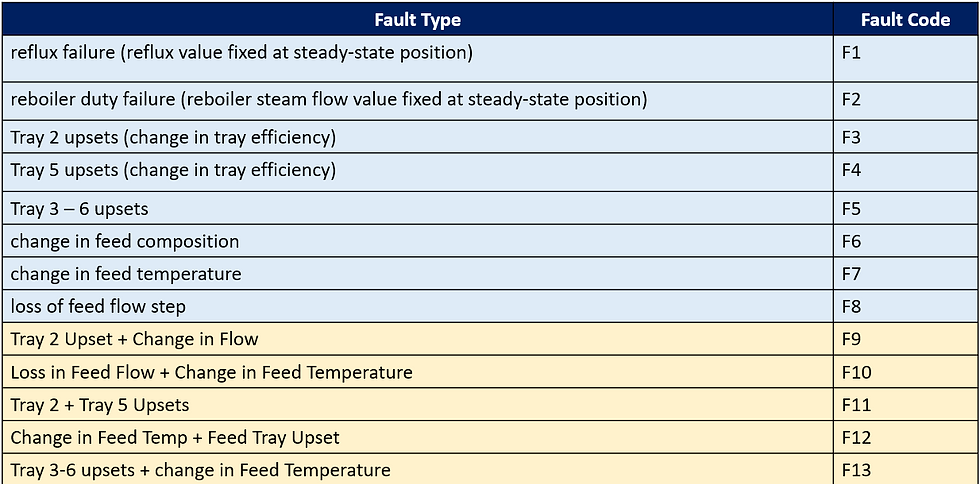

However, since PCA is an unsupervised machine learning, I dropped the STATUS column so that the data fed into the PCA algorithm is unlabeled.
The PCA is projected to 2 components and I would like to visualise the first component t[1] into a line chart to let us see how it behaves. For better interactivity, I used Plotly Express to generate the chart

It seems that there are multiple abnormalities in the chart. As mentioned before, our intuition suggested that sudden fluctuation or any distinctive pattern in the plot indicates process fault. To prove this statement, I re-combined the PCA dataframe with the STATUS before generate a new chart with color representing the STATUS of the distillation column
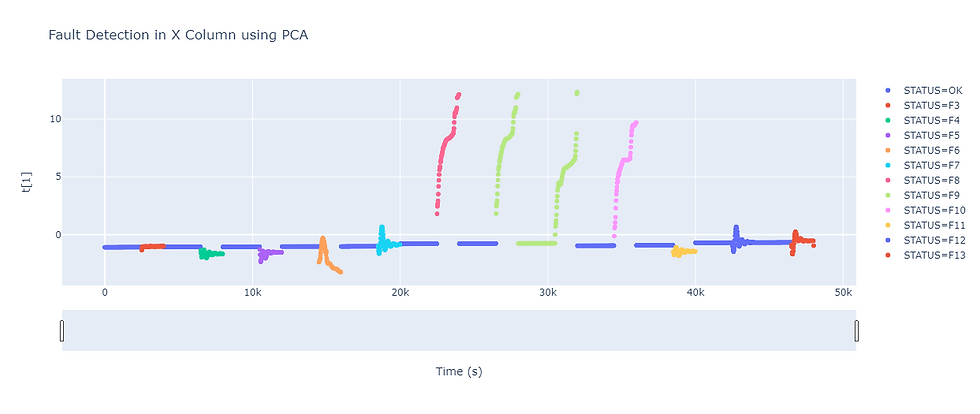
Now, we can see clearly the fault occurs in the distillation column using PCA.
Execution (Simulating Real Life Situation)
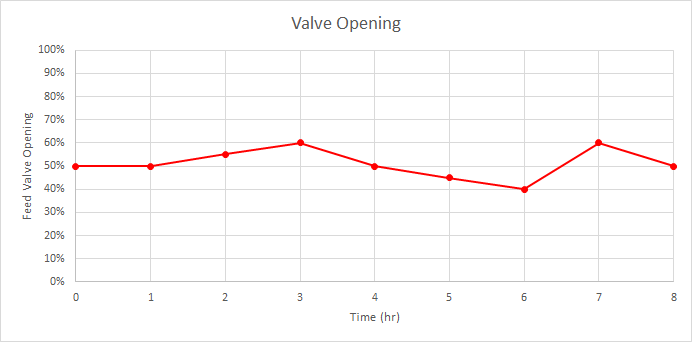
This time, we will perform PCA using new dataset which consist of process variables and properties of distillation column taken every 30 seconds and operated for 9 hours. It is said that a fault occured during sampling. However, there are no clear indication of any anomalies happened. Thus, we analyse the data using PCA. The working process is almost the same as I did before. Let's see the t[1] plot

An obvious abnormalities can be seen in the figure above, and it goes back to the original coorndinates (Assuming there was possibility the fault were remove without need of shutdown). Now let's see what the second component (t[2]) tells us:

The patterns seems a bit different from the first component. But there is something that we can relate with. We can conclude the the first spike indicated the starting of the fault and the second spike indicates the end of the fault returning to normal condition. Let's see the plot of t[2] vs t[1]

This plot, however, seems like unable to tell us anything significant. So I developed biplot with Hottelings T2 and SPE using pca package from PYPI library
# We start with defining the PCA model
pca_model = pca(n_components=2)

# Then we run or what we call "fit" the model with data 'x'
pca_2 = pca_model.fit_transform(x)

#Now, lets visualise the plot

fig = pca_model.biplot(figsize=(30, 15),
                   legend = False,
                   SPE=True,
                   hotellingt2=True)
Now we can see where the normal condition is, where is the outliers and at what time/which point the condition starts to deteriorate.
References
Schmalen, P. (2020, August 16). Understand your data with principal component analysis (PCA) and discover underlying patterns. Medium. Retrieved October 22, 2021, from https://towardsdatascience.com/understand-your-data-with-principle-component-analysis-pca-and-discover-underlying-patterns-d6cadb020939.
Massaron, L., & Mueller, J. P. (2019). In Machine learning for dummies (pp. 230–232).
Multiple Fault Diagnosis in Distillation Column Using Multikernel Support Vector Machine Syed A. Taqvi, Lemma Dendena Tufa, Haslinda Zabiri, Abdulhalim Shah Maulud, and Fahim Uddin Industrial & Engineering Chemistry Research 201857 (43), 14689-14706 DOI: 10.1021/acs.iecr.8b03360


Comments